The Ad Hoc Report creates a list of selected data fields arranged in columns. There are several ways to view and limit the data set. This utility allows you to export data in .csv format which can then be opened in Excel. Once in Excel you can use the file to send mass emails to selected email addresses using Microsoft Word. You can also easily create Pivot Tables and Pivot Charts.
Ad Hoc Reports functions as a query tool. It is secure enough to use in a hosted environment and can be restricted to users who have been granted permission to use it. The program joins tables for you, and you can sort the results by clicking on a column heading. When you want to exclude or limit information in one or more of the columns, use the filter at the top of each column of data.
You can use Export Report for existing reports.
Use Import Report to to imports an previously exported Ad Hoc report.
This Section Includes:
ØName
Begin by giving the report a name and description.
•Report Name:
•Report Desc:
An Entity is a collection of fields from a table (and related tables) used for reporting purposes. You will see a list of available entities on the left side of the page.
Double-click an Entity from the Query Builder or drag it into the work area.
1. When using CorePerson, make sure it is the first Entity added to the work area.
2. Once you have one Entity added to the work area, do not add any more Entities from the left-hand pane in Query Builder. When you scroll down the list of fields in the first Entity, you will see other Entities that you can join together. Use this to add a second Entity to the work area, and so on.
Put a check mark next to the fields that you want to display.
At the bottom of the list, you will see other entities that you can connect with.
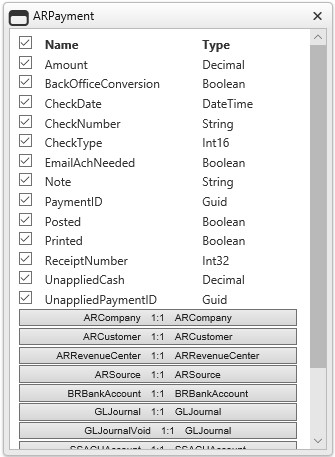
1:1 - one to one (one field in one entity matches with one field in another entity - example: 1 AR Payment links to 1 Journal Entry)
1:* - one to many (one field in one entity matches with many fields in another entity - example: 1 AR Bill links to several Invoices)
Choose one of the entities at the bottom of the list (matching fields are selected for you).
Refresh the Data Grid by clicking the Refresh ![]() button on the upper right side of the screen.
button on the upper right side of the screen.
The fields that are checked will display.
You can re-sort data within a column by clicking on the column header. You can change the order of the columns by dragging header names to different locations. You can group a column header(s) by dragging and dropping them onto the row just below the Data Grid. This action will group your data by the categories within the column (example: full and part time employees).
Click the Filter ![]() icon to limit data in the column (options will vary depending on data type - some examples listed are below):
icon to limit data in the column (options will vary depending on data type - some examples listed are below):
•EqualTo
•NotEqualTo
•IsNull
•NotIsNull
•Between
•NotBetween
Click the appropriate icon on the upper right side of the screen to Export to Excel (holds the groups), PDF, CSV or Word.
![]()
Click the Save ![]() button and the data is saved (per user - for security purposes).
button and the data is saved (per user - for security purposes).
Ad Hoc Reports can be shared by the report creator with other staff members (Users). Assign “Read Only” or “Update” Permissions to each user as needed. Users with Update permissions can make changes and save the revised report using a new report title